

Turnout First: Forecasting the 2026 Midterms
The Decision
Keep an input only if it beats a simple baseline out of sample, under a rule written down before any testing. Race polls passed, at the cost of intervals that are too narrow; fundraising and challengers’ track records failed, and early vote could not be tested at all, so all three were left out.
Takeaways
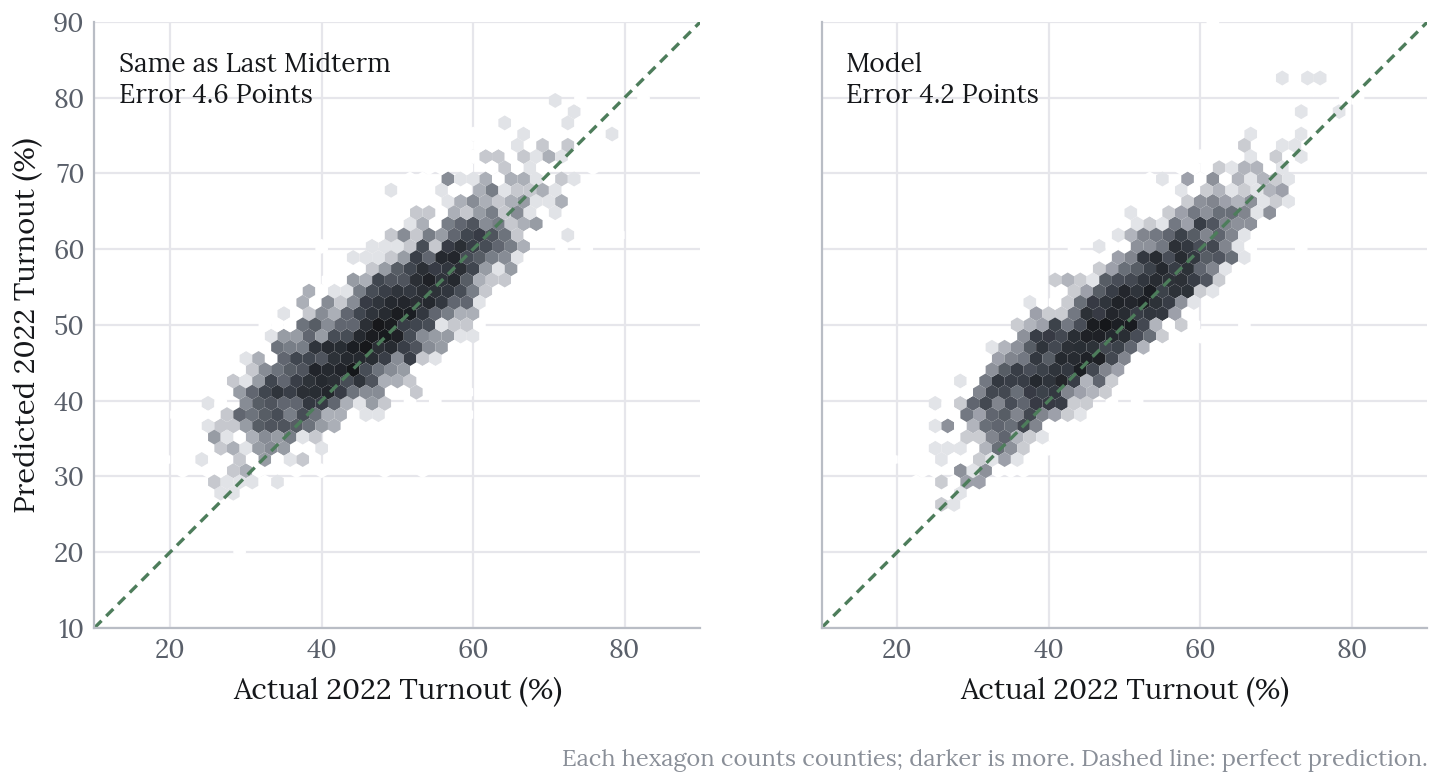
- The county turnout model beats “same as the last midterm” in both backtests: 6.4 points of error against 10.5 in 2018, and 4.2 against 4.6 in 2022.
- Race polls halve the 2022 Brier score (0.067 to 0.031), but their 80% intervals caught only 77% of results. The most confident calls are probably overstated.
- The House model beats both baselines in 2022, though only narrowly against uniform swing on vote share.
- Weighting by forecast turnout barely moves state leans: turnout matters for the county picture and for uncertainty, not for who is forecast to win.
- The v1 forecast favours Democrats in the House (93%), narrowly in the Senate (63%) and for a majority of governorships (62%).
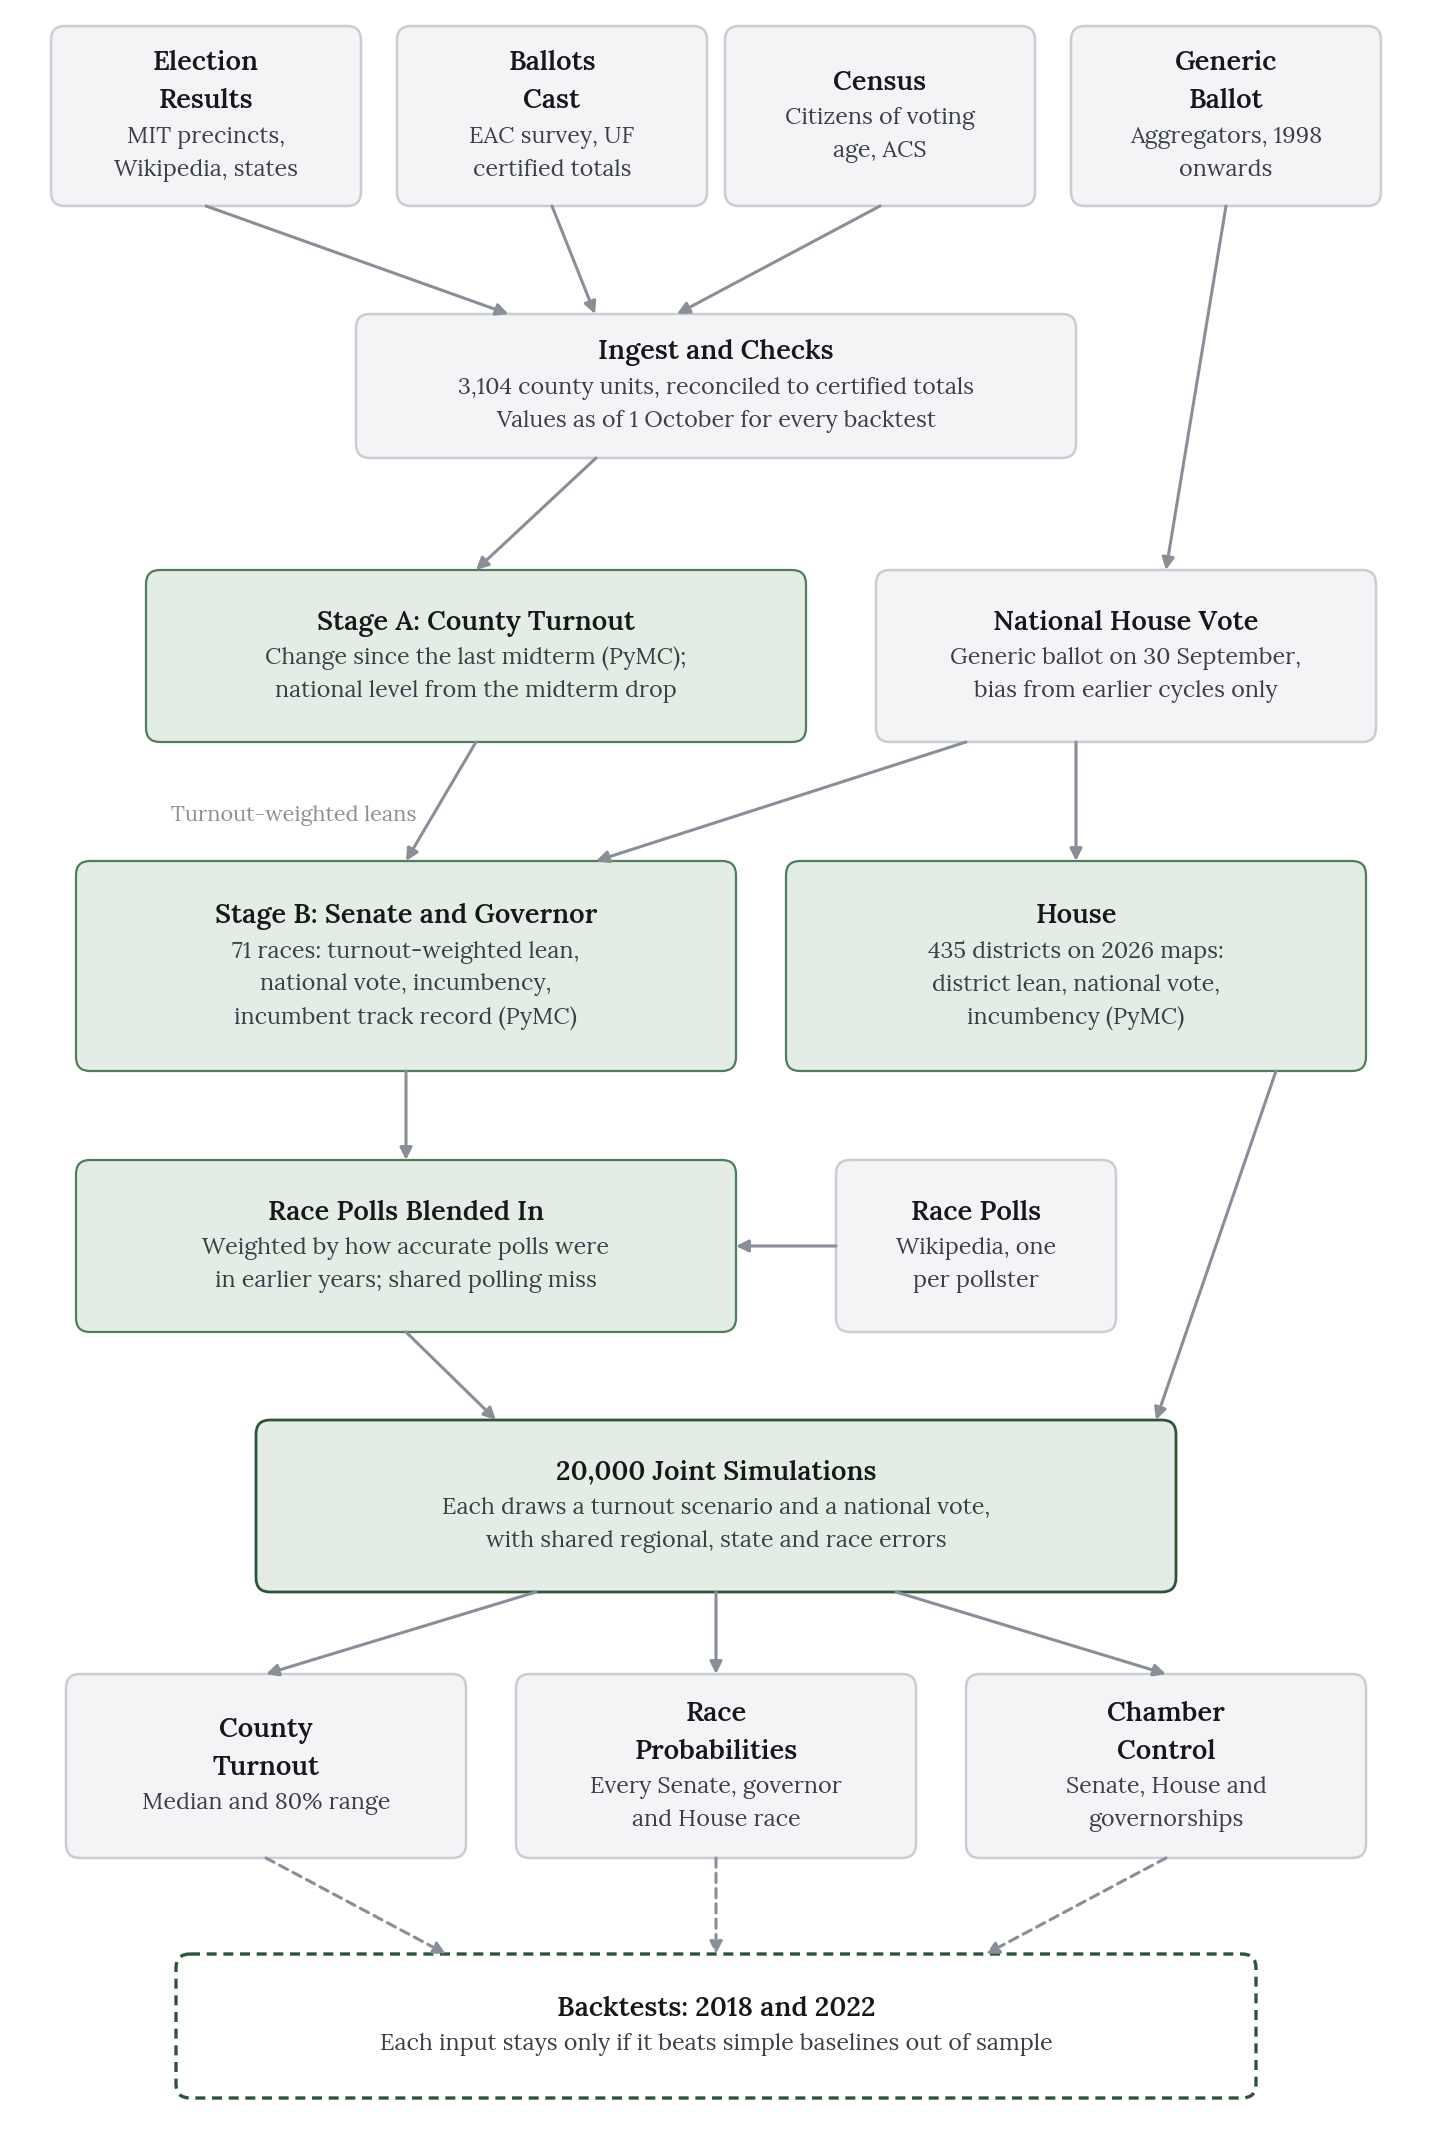
Turnout First is a forecast of the 3 November 2026 US midterms, built entirely from public data. It covers turnout in every county, the chance that each side wins every Senate and governor race (71 in all) and all 435 House seats. The forecast was published as a timestamped, tagged Git commit, so it cannot be revised after the fact, and it will be scored against the certified results.
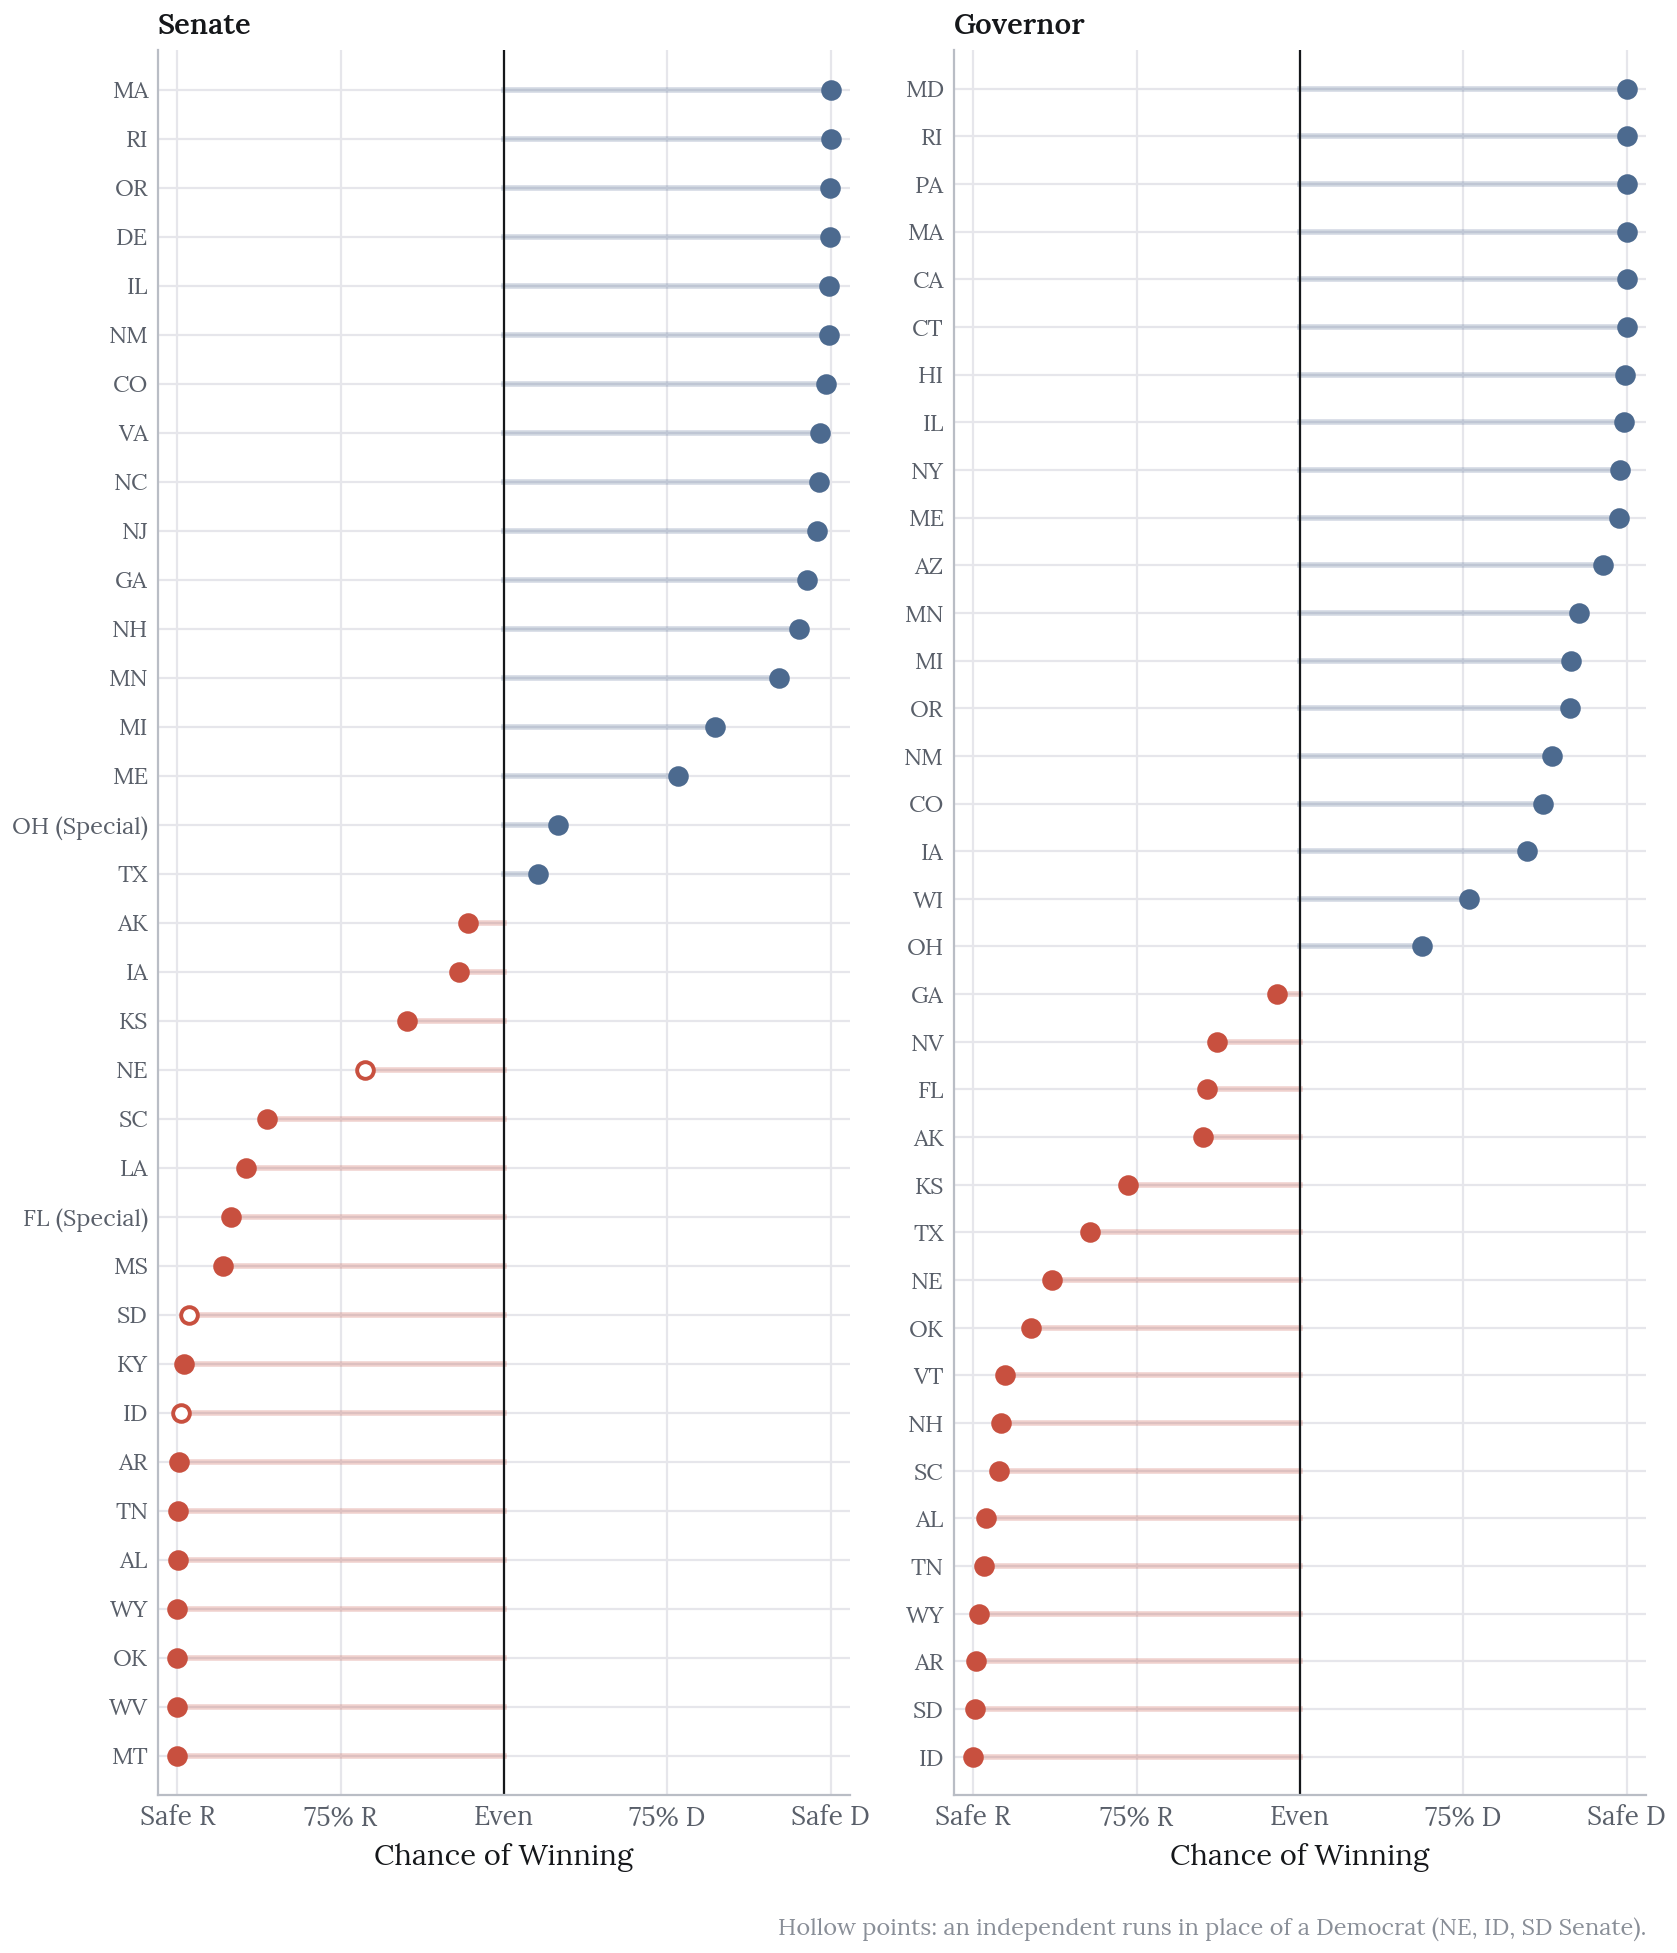
Most public forecasts begin with who wins; this one begins with how many people vote. It expects national turnout of 47.9% of citizens of voting age, a little above the 46.5% of 2022. Democrats reach 51 Senate seats in 63% of simulations, while Republicans keep 50 or more in 33%; Democrats also hold a majority of governorships (26 or more) in 62% and win 218 or more House seats in 93%. The more durable finding, though, concerns the method rather than the result: forecasting turnout first improves the county picture considerably and changes the race forecasts very little.
Source code: github.com/olivia-jackson-lambert/midterms-forecast-2026, with the published forecast at the v1 tag.
The Question
How many people will vote in each county on 3 November 2026 and, given that, what is the chance that each side wins each Senate, governor and House race?
The scope was fixed before any modelling began: county turnout as a share of citizens of voting age, with an 80% interval, and the two-party vote share and win probability for every Senate and governor race. The House began as a stretch goal and was added on 13 October, once the rest was built, under the same backtest rule. Primaries, ballot measures and state legislatures are out of scope.
Why Turnout First
Midterm turnout moves a great deal. Measured against the voting-eligible population it was about 37% in 2014, 50% in 2018 and 46% in 2022, a far wider swing than presidential years show; a forecast that treats the electorate as fixed is therefore ignoring the most variable part of a midterm.
Starting with turnout also gives the forecast something concrete to be wrong about. A county turnout map can be checked against certified results county by county, which is a far larger test than 71 races, and because each simulation draws turnout first, uncertainty about who votes carries through into every vote share.
Whether turnout would change who is forecast to win was an open question at the outset. It turned out not to, and that result, reported below, is one of the more instructive in the project.
The Data
Every source is public and needs neither an API key nor a download form, with the single exception of the FEC, which issues a free key.
| Need | Source |
|---|---|
| County presidential results, 2008 to 2024 | MIT Election Lab county returns (2008 to 2016); a county results mirror on GitHub (2020 and 2024) |
| Midterm ballots cast by county, 2014 to 2022 | EAC Election Administration and Voting Survey (EAVS) |
| Certified state totals and national turnout since 1980 | UF Election Lab (Michael McDonald) |
| Midterm county results, 2018 and 2022 | MIT Election Lab precinct returns, plus state sources for California and Tennessee in 2022 |
| Turnout denominator | Census citizen voting-age population (CVAP), the five-year vintage centred on each election |
| County demographics | American Community Survey 2020 to 2024 |
| Generic ballot, 1998 to 2026 | FiveThirtyEight’s daily average; for 2026, the mean of five aggregators listed on Wikipedia |
| Races, nominees, incumbents and past results | Wikipedia’s Senate, governor and House election pages, parsed from saved copies |
| Race polls, 2018 to 2026 | The poll tables in each race’s Wikipedia article |
| Presidential results by House district | The Downballot and Daily Kos Elections public sheets, on the map in force each year |
Counties and reported results do not line up everywhere, so the model works on 3,104 county units: Alaska, Connecticut and DC are one unit each, and a few counties are merged where results and Census boundaries disagree, such as the three around Kansas City, which reports its results separately.
None of these sources could be used as downloaded. The main problems, and how each was resolved:
Party labels and totals. MIT’s simplified party column is wrong for some nominees (in 2022 it labels Tim Walz in Minnesota as “other”), so votes are assigned by matching the nominees parsed from the race pages; its total-votes column is also wrong in places, so totals are summed from candidate votes instead. The GitHub mirror undercounts California, New York and Rhode Island by several million votes in 2012 and 2016, and is used only for 2020 and 2024.
EAVS gaps. Alabama’s 2014 figures are registrations rather than ballots, Illinois 2014 is blank, Hawaii and Utah 2014 are off by about a third, and Wisconsin’s 2018 and 2022 files carry no county codes. Every county figure is therefore checked against two references and replaced where it fails, and each state is scaled to UF’s certified total. Rows that had to be estimated (256 units in 2014, five in each later year) are never used for training.
Leaks from the future. It is easy, and flattering, to backtest with the final pre-election polling average, which a forecaster on 1 October would not have had. Every backtest here instead uses the generic ballot as it stood on 30 September (or the last archived value before it) and only those race polls whose fieldwork ended by 26 September.
The Turnout Model
The turnout model has two levels, both fitted in PyMC.
National. Midterm turnout is modelled as the last presidential turnout minus a midterm drop, with the drop and its spread estimated from every midterm since 1986 that precedes the target year. Out of sample since 1998, this beats “same as the last midterm” (a logit error of 0.19 against 0.23).
County. Each county’s change from the last midterm depends on how far presidential turnout ran above that midterm, a pull back towards the county’s own average, a Senate race joining or leaving the ballot, the closeness of the top race, an out-party effect (county lean multiplied by any change in which party holds the White House), seven demographic slopes and a state effect. County noise follows a Student-t distribution that widens for small counties, and the model is fitted on the 2014 to 2018 and 2018 to 2022 transitions.
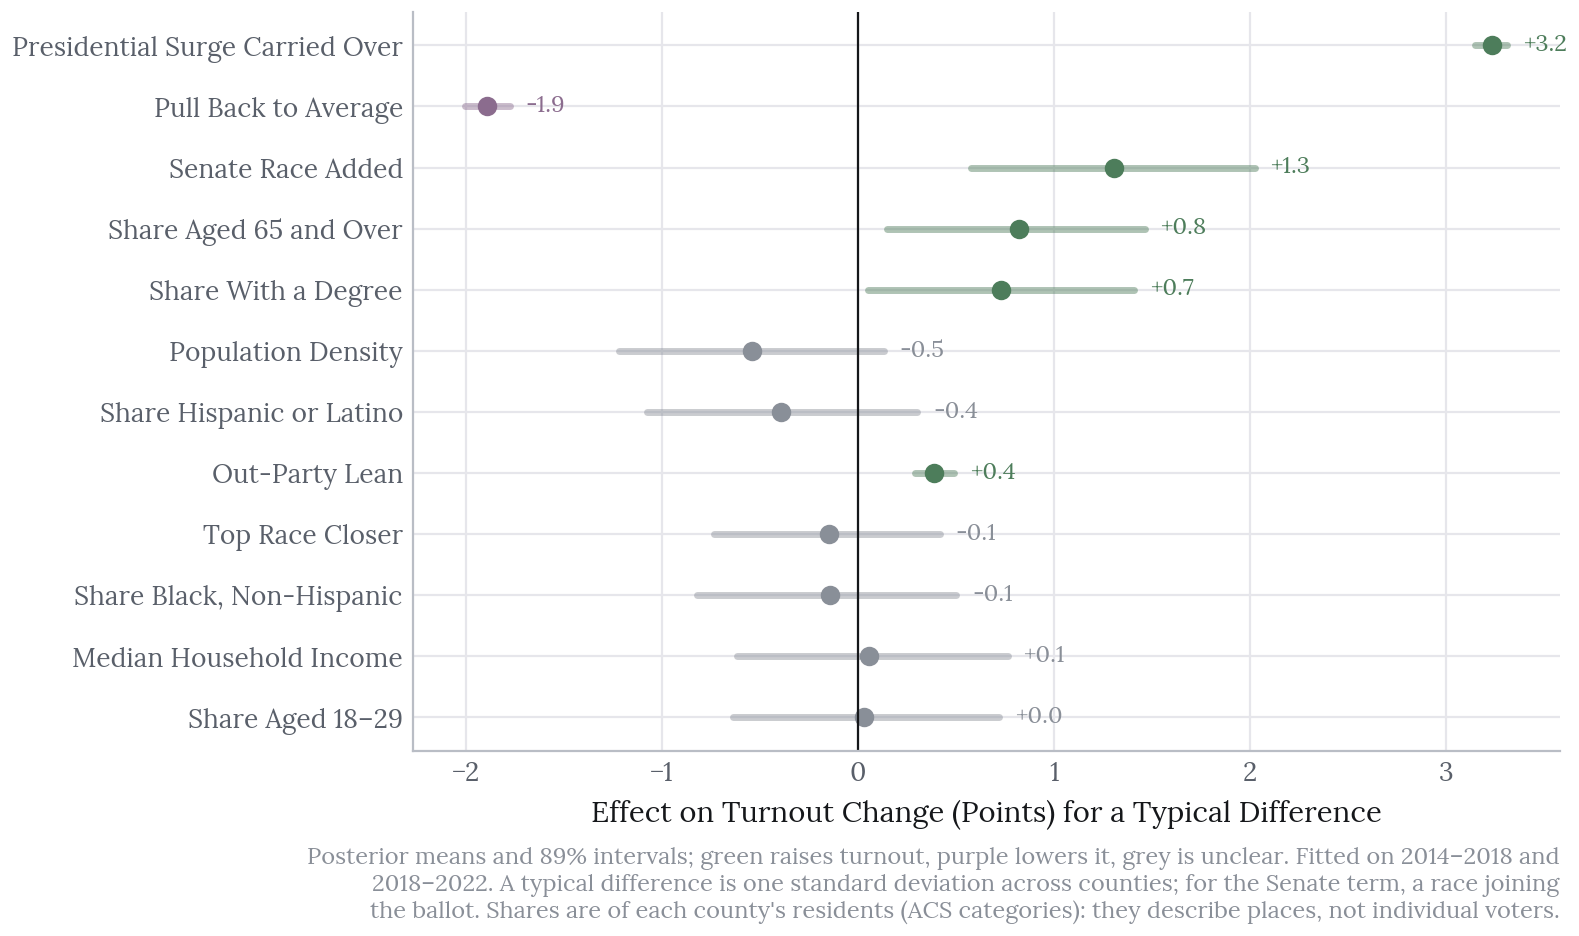
The strongest predictor is how much of the last presidential surge carries over: a county whose 2024 turnout ran well above its 2022 level tends to stay higher. A Senate race on the ballot adds about 1.3 points, while most of the demographic slopes are too uncertain to call in either direction.
Each of the 20,000 simulations draws a national turnout and then shifts every county by the same amount on the logit scale, so that the counties add up to the national total.
There was one deviation from the plan. The out-party term was added after the first backtest revealed a county-size bias that flipped sign between 2018 and 2022; both versions are reported in the backtests, and the forecast uses the version that includes it.
The Vote Model
The vote model forecasts the Democratic share of the two-party vote in each Senate and governor race, on the logit scale, as the sum of four parts:
- the national House vote, drawn from the 30 September generic ballot with its historical bias and spread, estimated from earlier cycles only;
- the state’s lean against the nation, from the last presidential result re-weighted county by county with the turnout forecast;
- incumbency, and the incumbent’s track record: how their last result compared with what a uniform swing predicted;
- regional, same-state and race errors.
Together these make up the fundamentals forecast. At the end of September the generic ballot has overstated the Democratic House vote in 11 of the 12 cycles since 1998, by 1.7 points on average, and the model corrects for this; the 2026 generic ballot of 54.7% two-party therefore becomes a national House vote of 52.9% (80%: 51.3 to 54.5).
Crucially, the errors are shared. Every simulation draws one national error together with regional and same-state errors, so the races move together rather than independently; treating them as independent is the most common way for a forecast to become overconfident.
In Nebraska, Idaho and South Dakota the Senate race has no Democrat, and an independent challenger faces the Republican instead. The model treats the independent as it would a Democrat, with added uncertainty, and a seat the independent wins is not counted as Democratic.
An earlier version looked better in its backtests than it had any right to, because it used the final pre-election generic ballot and set its error floors with reference to the 2022 results. It was rebuilt from scratch on the inputs described above.
Adding Polls
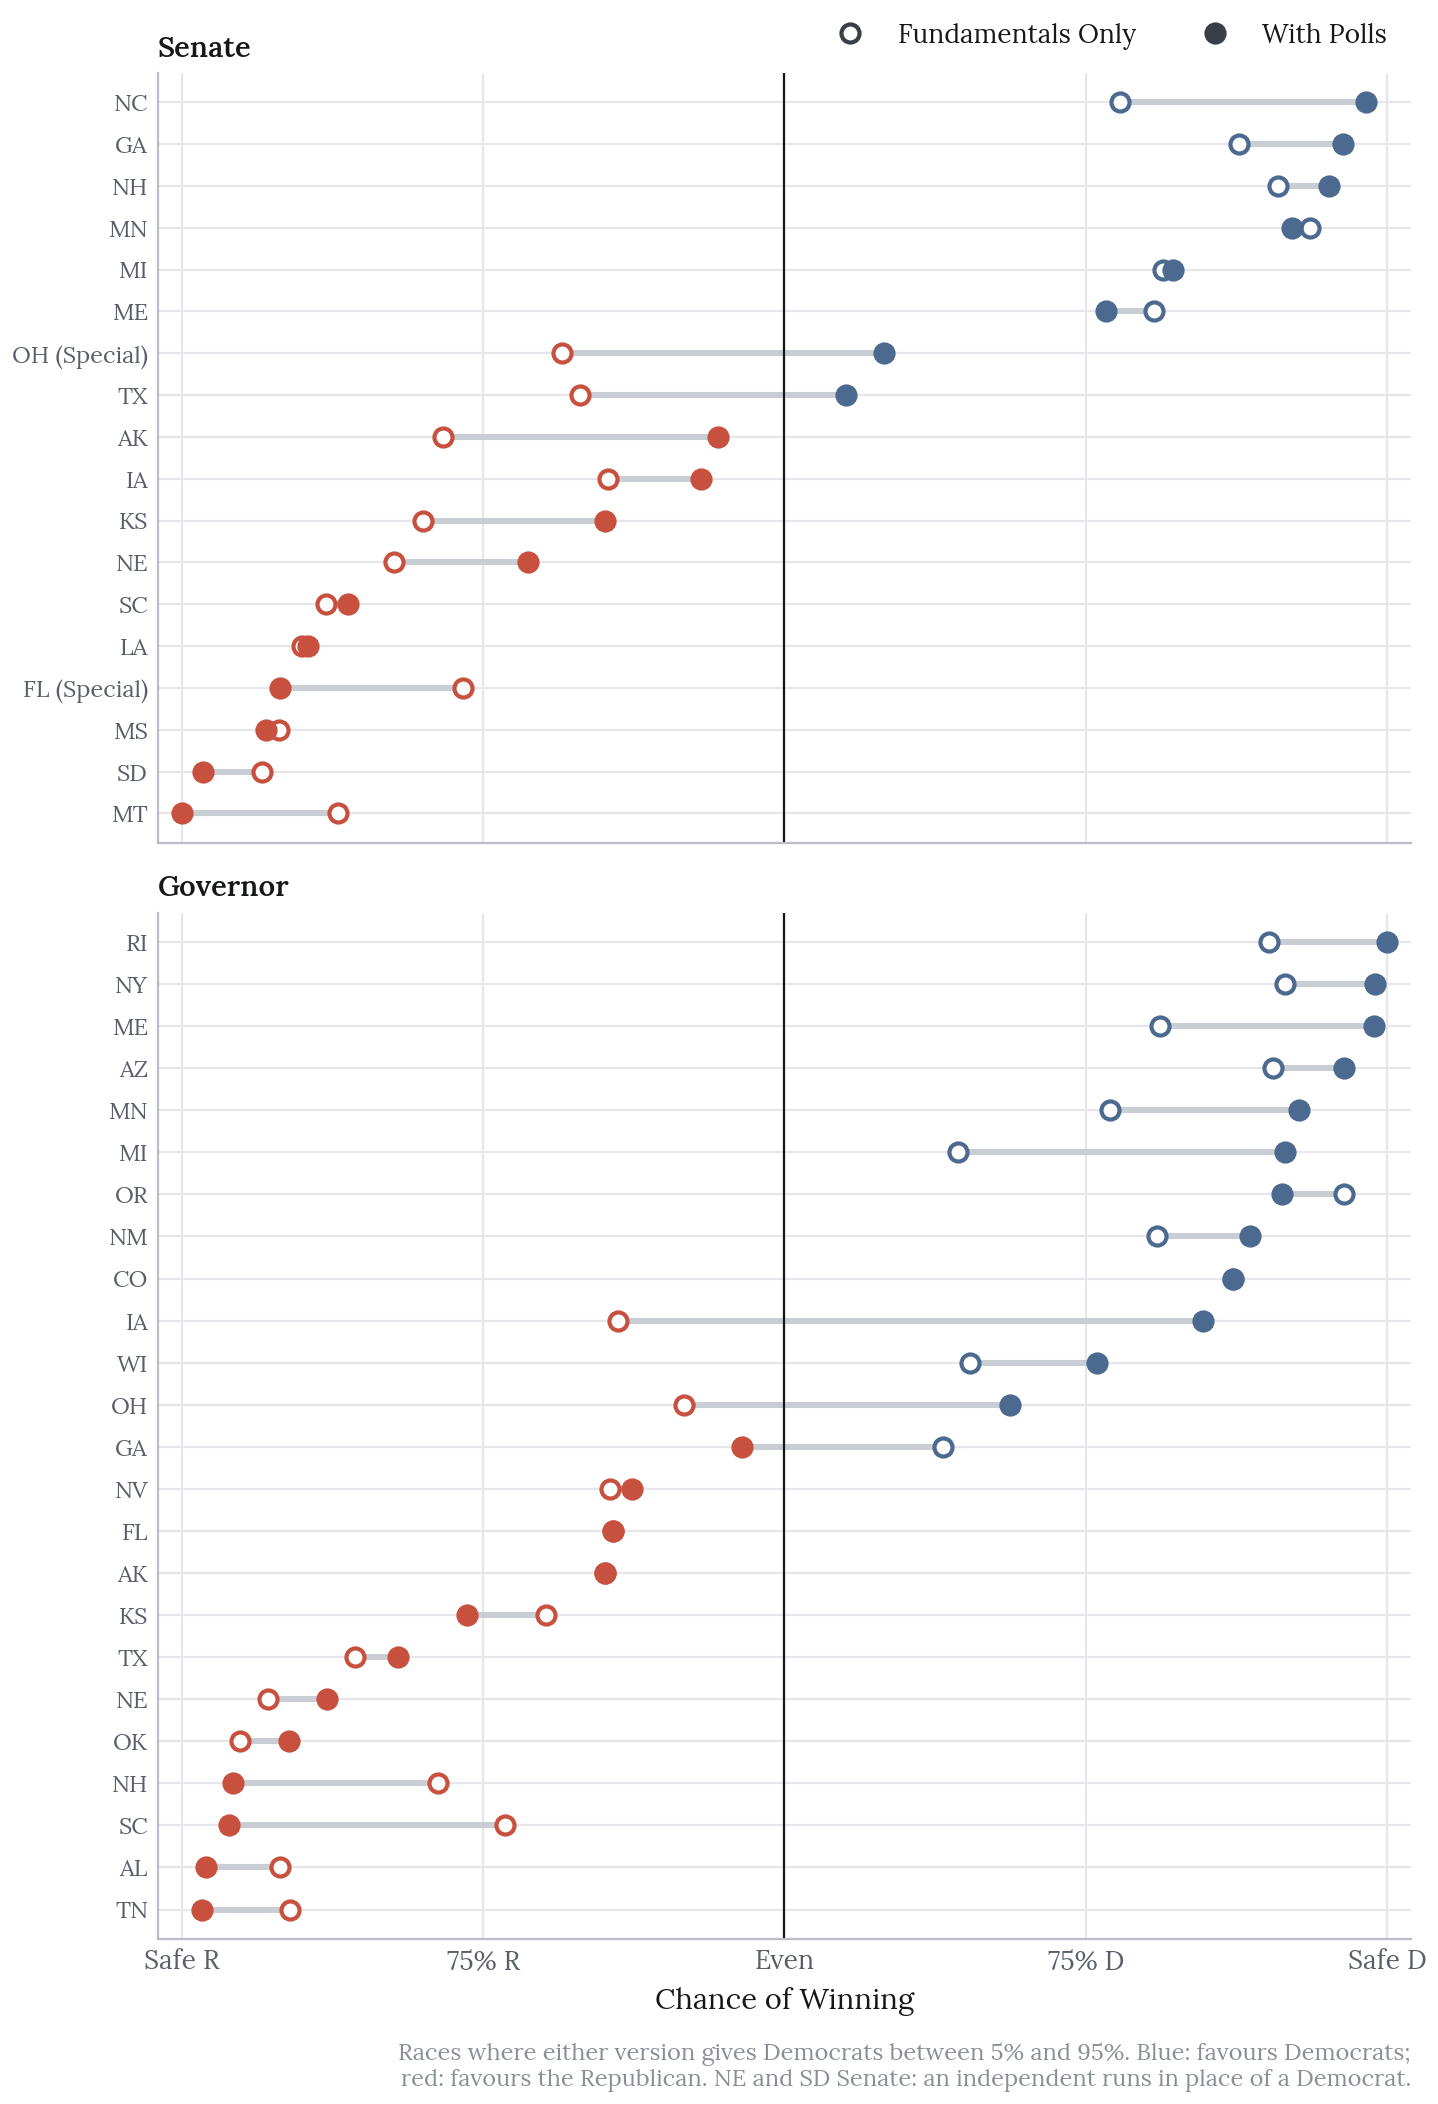
The fundamentals forecast knows nothing about the candidates beyond incumbency, which is the main reason it disagreed with the published ratings in Texas, Ohio, Alaska and Iowa. Race polls were therefore added as a separate layer on top.
What. For each race the poll tables are taken from its Wikipedia article, keeping only head-to-heads between the actual nominees; in the backtests a poll counts only if its fieldwork ended by 26 September. In 2026, 60 of the 71 races have at least one qualifying poll. The remainder, mostly safe seats along with the Florida, Colorado and Alaska governor races, keep the fundamentals forecast.
How. Each race receives a poll average built from each pollster’s latest poll, preferring likely voters and weighting towards recent polls (with a 21-day half-life) and larger samples. The model treats that average as a noisy reading of the result. Polls miss in two ways: through a national error that every race shares in a given year, and through a race error that shrinks as polls accumulate, and the size of each is fitted on earlier years only. In each simulation the forecast moves from the fundamentals towards the polls in proportion to their precision, with a single national polling error drawn for every race at once; in 2026 the polls receive a median weight of about 70%.
The gain. Polls faced the same rule as every other input: keep them only if they improve the 2022 backtest on both Brier score and vote-share error. They do, and by a wide margin. The 2022 Brier score falls from 0.067 to 0.031 and the vote-share error from 3.6 to 2.7 points; in 2018, running on priors alone, the Brier score falls from 0.149 to 0.062.
The cost. The intervals are now too narrow. With polls, the 80% intervals contained 77% of the 2022 results and 71% of those in 2018. Two elections are not enough to size the national polling error well, and widening the intervals until the backtests looked right would amount to tuning to the test, which is precisely the mistake that sank the earlier version. The narrowness is therefore left in place and stated plainly: the most confident calls are probably overstated. North Carolina’s Senate race is the clearest case. The model gives Democrats 98% on a poll average of 55.6% from 18 polls, while the published ratings call the race Lean or Likely Democratic; it is better read as a clear favourite than a near certainty, and the same caution applies to every race above 90%.
Backtests
For 2018 and 2022, each model was fitted using only the data available on 1 October of that year and then scored against the results. Each also had a baseline to beat, under a rule set in advance: a model that failed to beat its baselines would be published as an analysis, not a forecast.
Turnout
| 2018 | 2022 | |
|---|---|---|
| Counties scored | 2,843 | 3,094 |
| Mean absolute error, model (points) | 6.4 | 4.2 |
| Same as last midterm | 10.5 | 4.6 |
| Weighted by population, model | 8.9 | 4.6 |
| Weighted, same as last midterm | 14.0 | 5.3 |
| 80% interval coverage | 96% | 89% |
| National turnout, 80% band | 38 to 48% | 44.5 to 56% |
| National turnout, actual | 50.9% | 46.5% |
| With national turnout known: error, coverage | 5.9, 99% | 3.9, 81% |
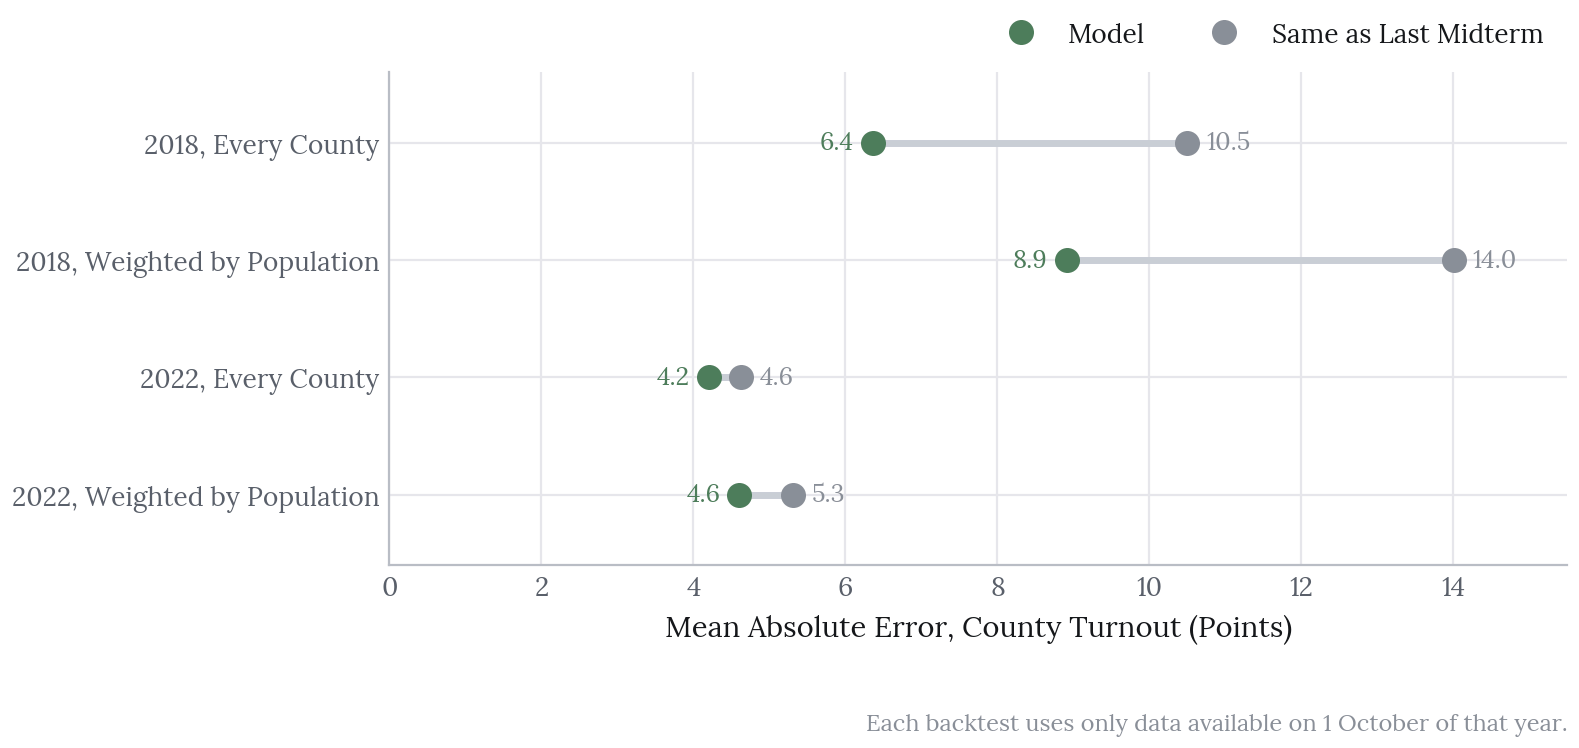
The model beats the baseline in both years, by a wide margin in 2018 and a more modest one in 2022.
Most of the remaining error is national: the 2018 surge to 50.9% fell outside the model’s national 80% band of 38 to 48%. With the national level known, the 2022 county intervals cover 81% of counties, close to the 80% they should. The 2018 intervals, by contrast, are too wide; there is no public county turnout for 2010, so that backtest had no earlier transition to learn from and ran on priors alone. Only 2022 therefore tests the full county model, and two elections can say little about whether the national band itself is calibrated, which is why it is deliberately wide.
The out-party term trades a little error for better intervals: without it, the 2022 error was 4.0 points rather than 4.2, but coverage with the national level known fell to 72%.
Races
These scores cover races with a Democrat against a Republican, 68 in 2018 and 70 in 2022. The 2018 model ran on priors alone, since there was no earlier comparable midterm to fit on, while the 2022 model was fitted on 2018.
| 2018 | 2022 | |
|---|---|---|
| Brier score, model with polls | 0.062 | 0.031 |
| Brier, fundamentals only | 0.149 | 0.067 |
| Brier, presidential lean called with certainty | 0.221 | 0.086 |
| Brier, lean plus uniform national swing | 0.162 | 0.157 |
| Vote-share error, model with polls (points) | 2.7 | 2.7 |
| Vote-share error, fundamentals only | 5.1 | 3.6 |
| Vote-share error, presidential lean | 5.9 | 4.3 |
| Vote-share error, uniform swing | 5.1 | 4.1 |
| 80% interval coverage, with polls | 71% | 77% |
| 80% interval coverage, fundamentals only | 96% | 86% |
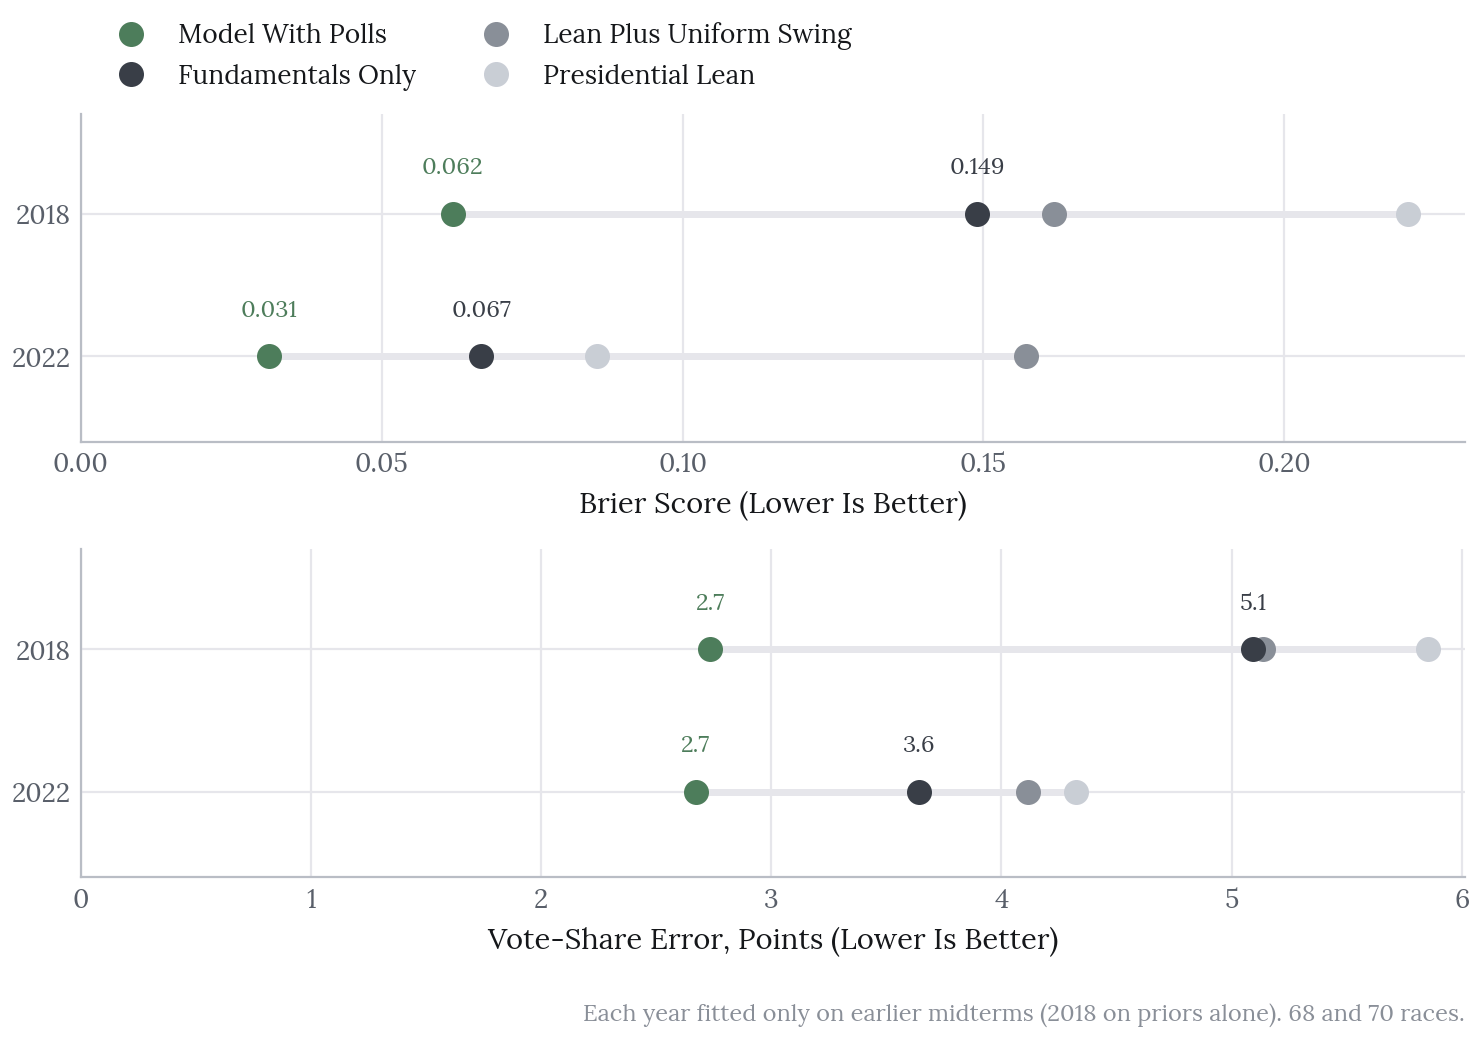
The fundamentals alone beat both baselines on Brier score in both years; on vote share they tie uniform swing in 2018 and beat it in 2022. Polls improve every score, and the published forecast uses them.
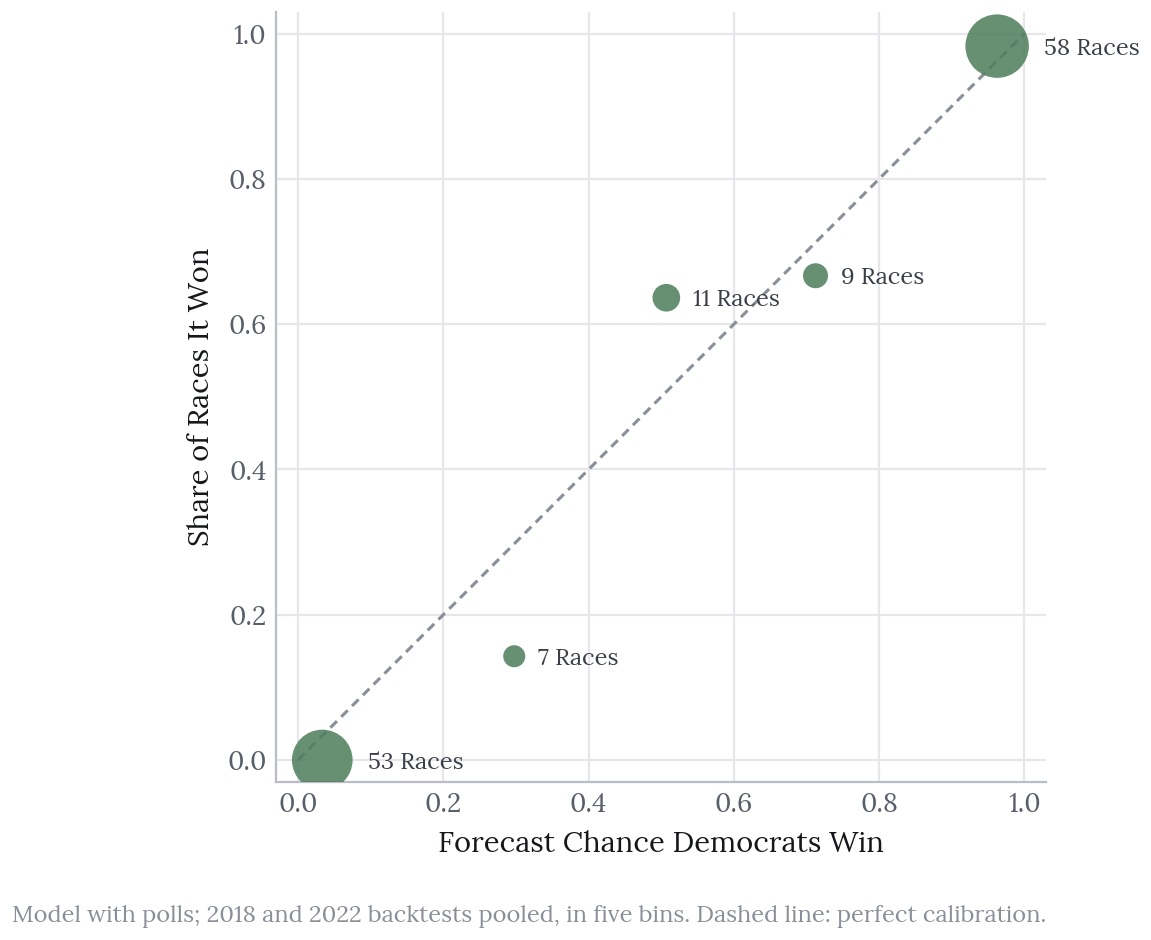
The ends of the scale are well calibrated: of the 111 races forecast below 20% or above 80%, all but one went the expected way. The 20 races between 40% and 80% went to Democrats 13 times against about 12 expected, although that is a small sample, and the interval coverage above is the more telling measure.
The House
Method. The House model shares the structure of the vote model. Each district’s lean is its 2024 presidential two-party share on the map in force for 2026 (nine states redrew for 2026, among them Texas, California, North Carolina and Ohio), moved by the same national House vote, by incumbency and by regional, state and district errors, all fitted in PyMC on earlier midterms only. Because each simulation draws the national vote and these errors together, districts in the same state move together. Two elements of the vote model are left out. Turnout weighting would need a county-to-district split of every new map, which is not public, and in any case barely moves leans; the incumbent’s track record, meanwhile, made the 2022 House backtest worse (a Brier score of 0.035 against 0.031) and so failed the rule. Fifteen districts with candidates from only one party are counted as certain holds.
The scores cover districts with a Democrat against a Republican (394 in 2018 and 399 in 2022), and both baselines are called with certainty.
| 2018 (priors only) | 2022 (fitted on 2018) | |
|---|---|---|
| Brier score, model | 0.058 | 0.031 |
| Brier, presidential lean | 0.084 | 0.055 |
| Brier, lean plus uniform swing | 0.053 | 0.055 |
| Vote-share error, model (points) | 2.8 | 2.2 |
| Vote-share error, presidential lean | 3.5 | 3.2 |
| Vote-share error, uniform swing | 2.8 | 2.3 |
| 80% interval coverage | 99% | 91% |
| Democratic seats, actual | 234 | 213 |
| Model median (80% interval) | 228 (191 to 291) | 210 (195 to 225) |
In 2022 the model beats both baselines, though only narrowly against uniform swing on vote share (2.2 against 2.3 points), and the actual seat count fell inside its 80% band. In 2018, running on priors alone, it does not beat uniform swing on Brier score and its intervals are far too wide; most of its edge comes from giving probabilities rather than certain calls. It passes the rule, and is presented here with that caveat.
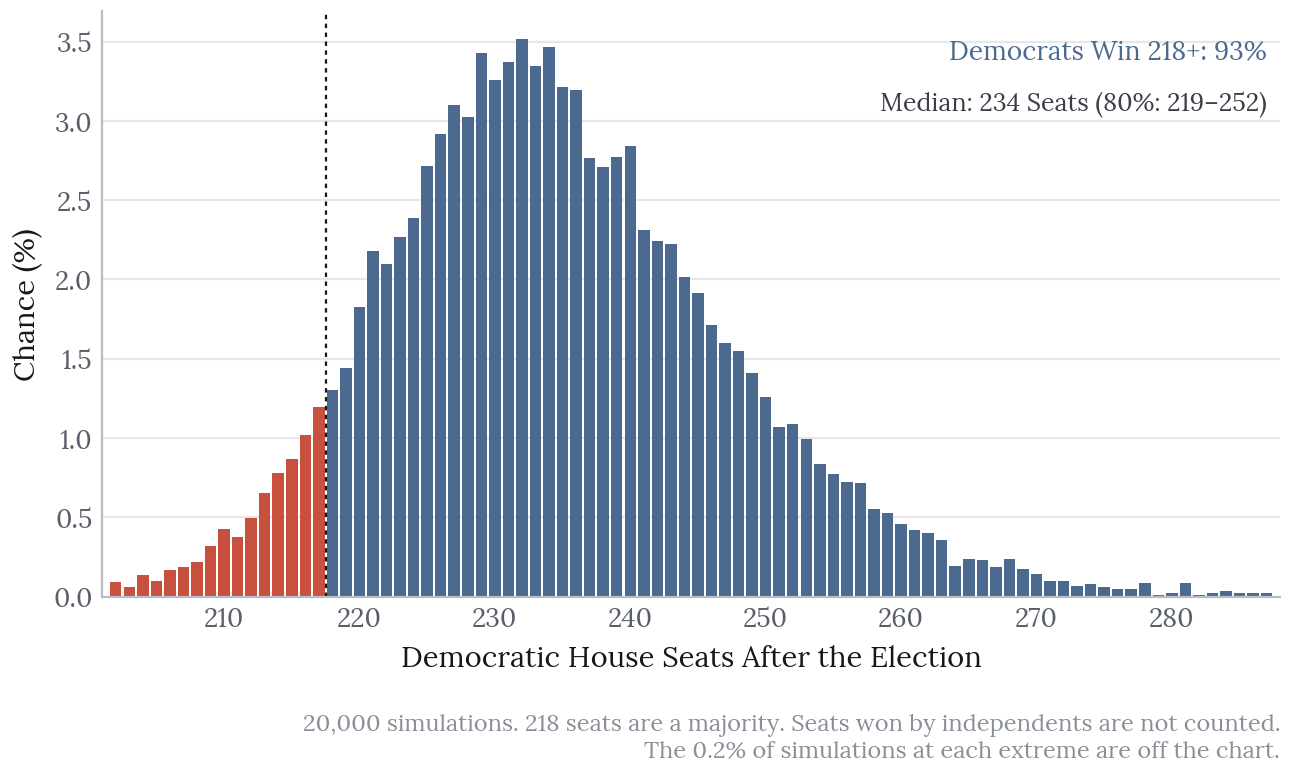
2026. Democrats win a median of 234 seats (80%: 219 to 252) and reach 218 or more in 93% of simulations, against 7% for Republicans. Thirteen districts give Democrats between a 40% and a 60% chance, and 50 fall between 20% and 80%.
Known gaps. Alaska and Maine are modelled on first-round shares rather than the ranked-choice final round, and Louisiana’s new map holds a first round on 3 November with several candidates per party, modelled as the summed Democratic vote against the summed Republican vote. Errors are shared only nationally, by region and by state, so districts that move together for other reasons are treated as independent within a state, and the seat interval may be a little narrow. Finally, with 2018 running on priors, a single midterm is a thin basis for the fitted slopes.
The 2026 Forecast
These are the numbers of forecast v1, the tagged commit of 22 October. The plan had been 19 October; the release slipped by three days, and every input is dated in the release manifest. No later version was released, so v1 is the forecast that will be scored.
| Forecast | 80% interval | |
|---|---|---|
| National turnout, share of citizens of voting age | 47.9% | 42.2 to 53.5% |
| National House vote, Democratic two-party share | 52.9% | 51.3 to 54.5% |
| Senate: Democrats reach 51 seats | 63% | |
| Senate: Republicans hold 50 or more | 33% | |
| Governors: Democrats hold 26 or more | 62% | |
| Democratic governors, median | 26 | 23 to 29 |
| House: Democrats win 218 or more | 93% | |
| Democratic House seats, median | 234 | 219 to 252 |
Turnout
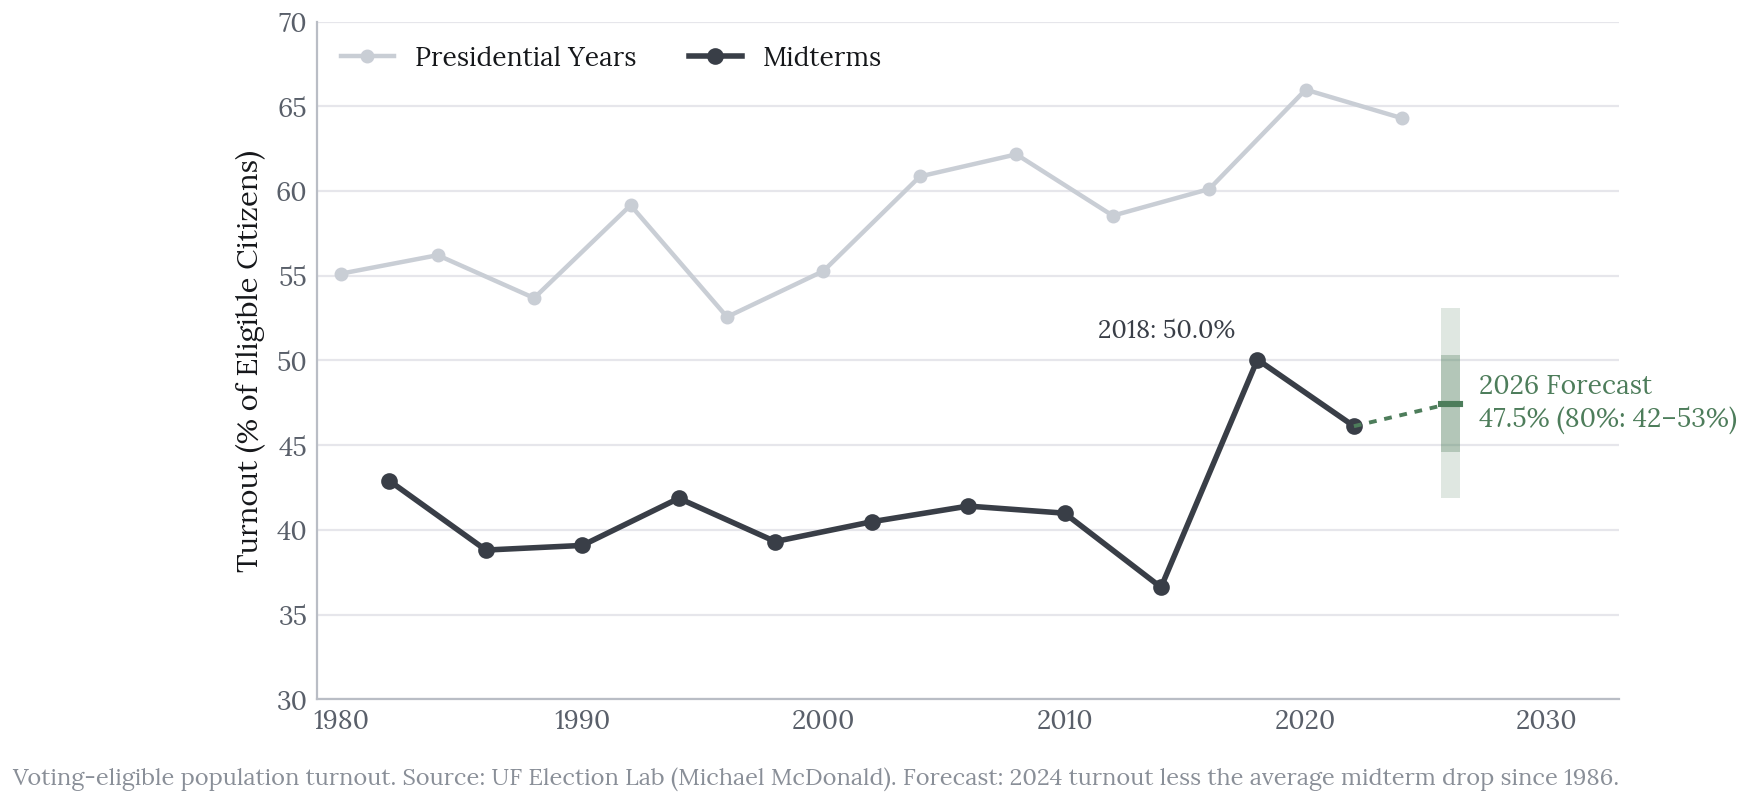
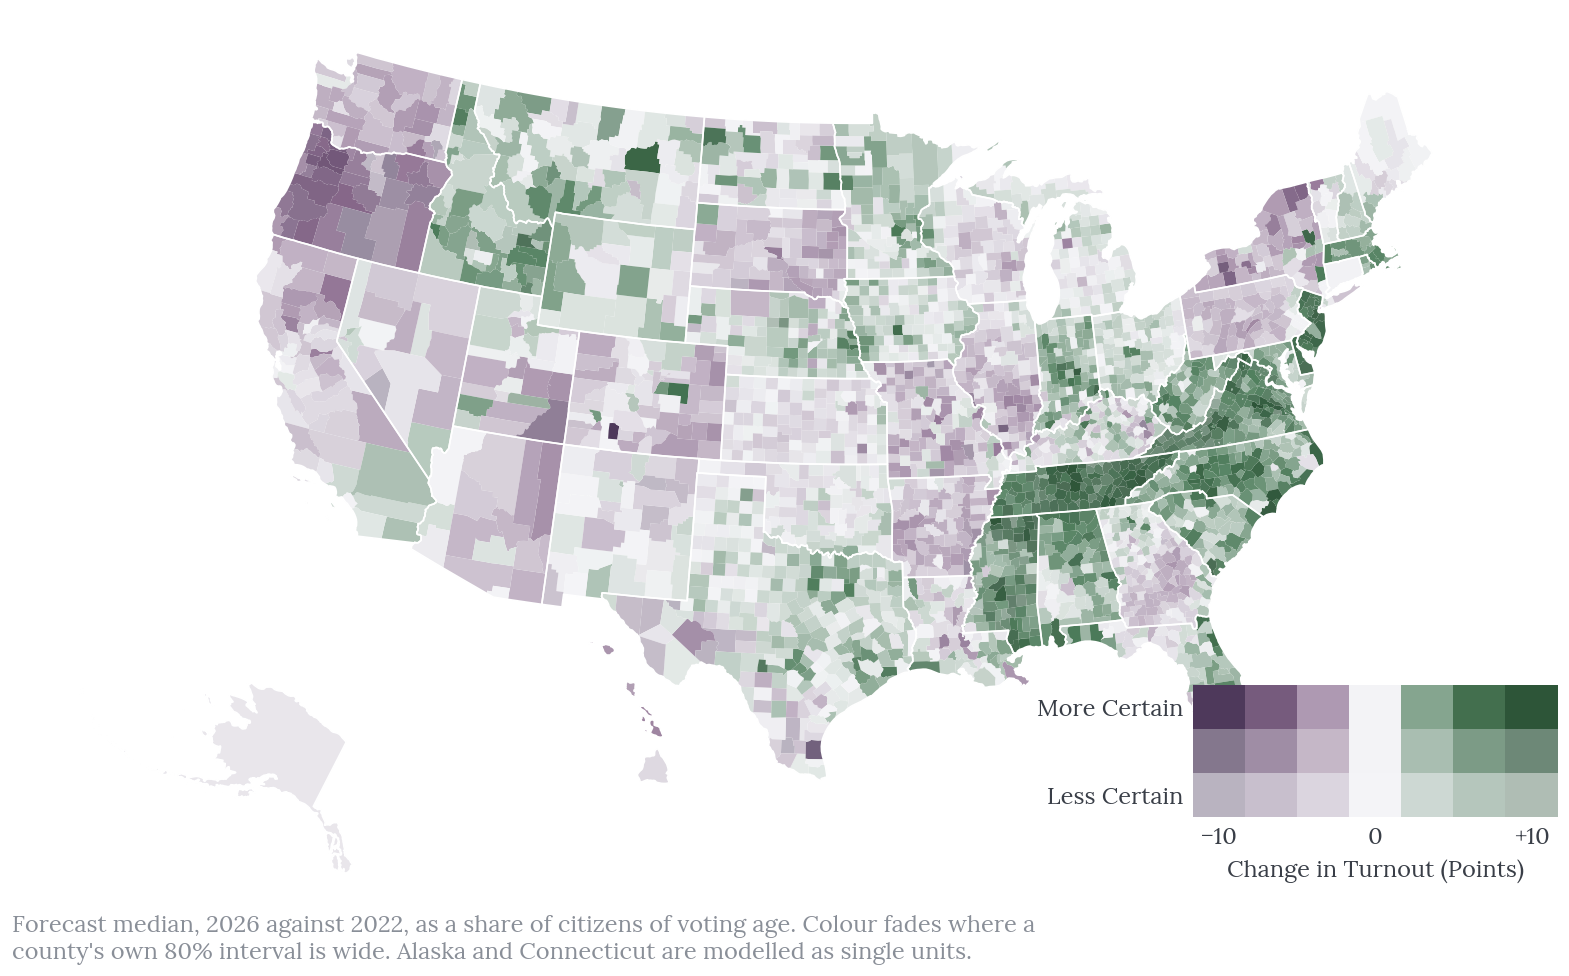
On the eligible-population basis used in the chart, national turnout is forecast at 47.5%. The county model uses the Census count of citizens of voting age as its denominator, which gives a slightly different figure of 47.9% (80%: 42.2 to 53.5%), against 46.5% in 2022. Turnout is forecast to rise in 58% of county units.
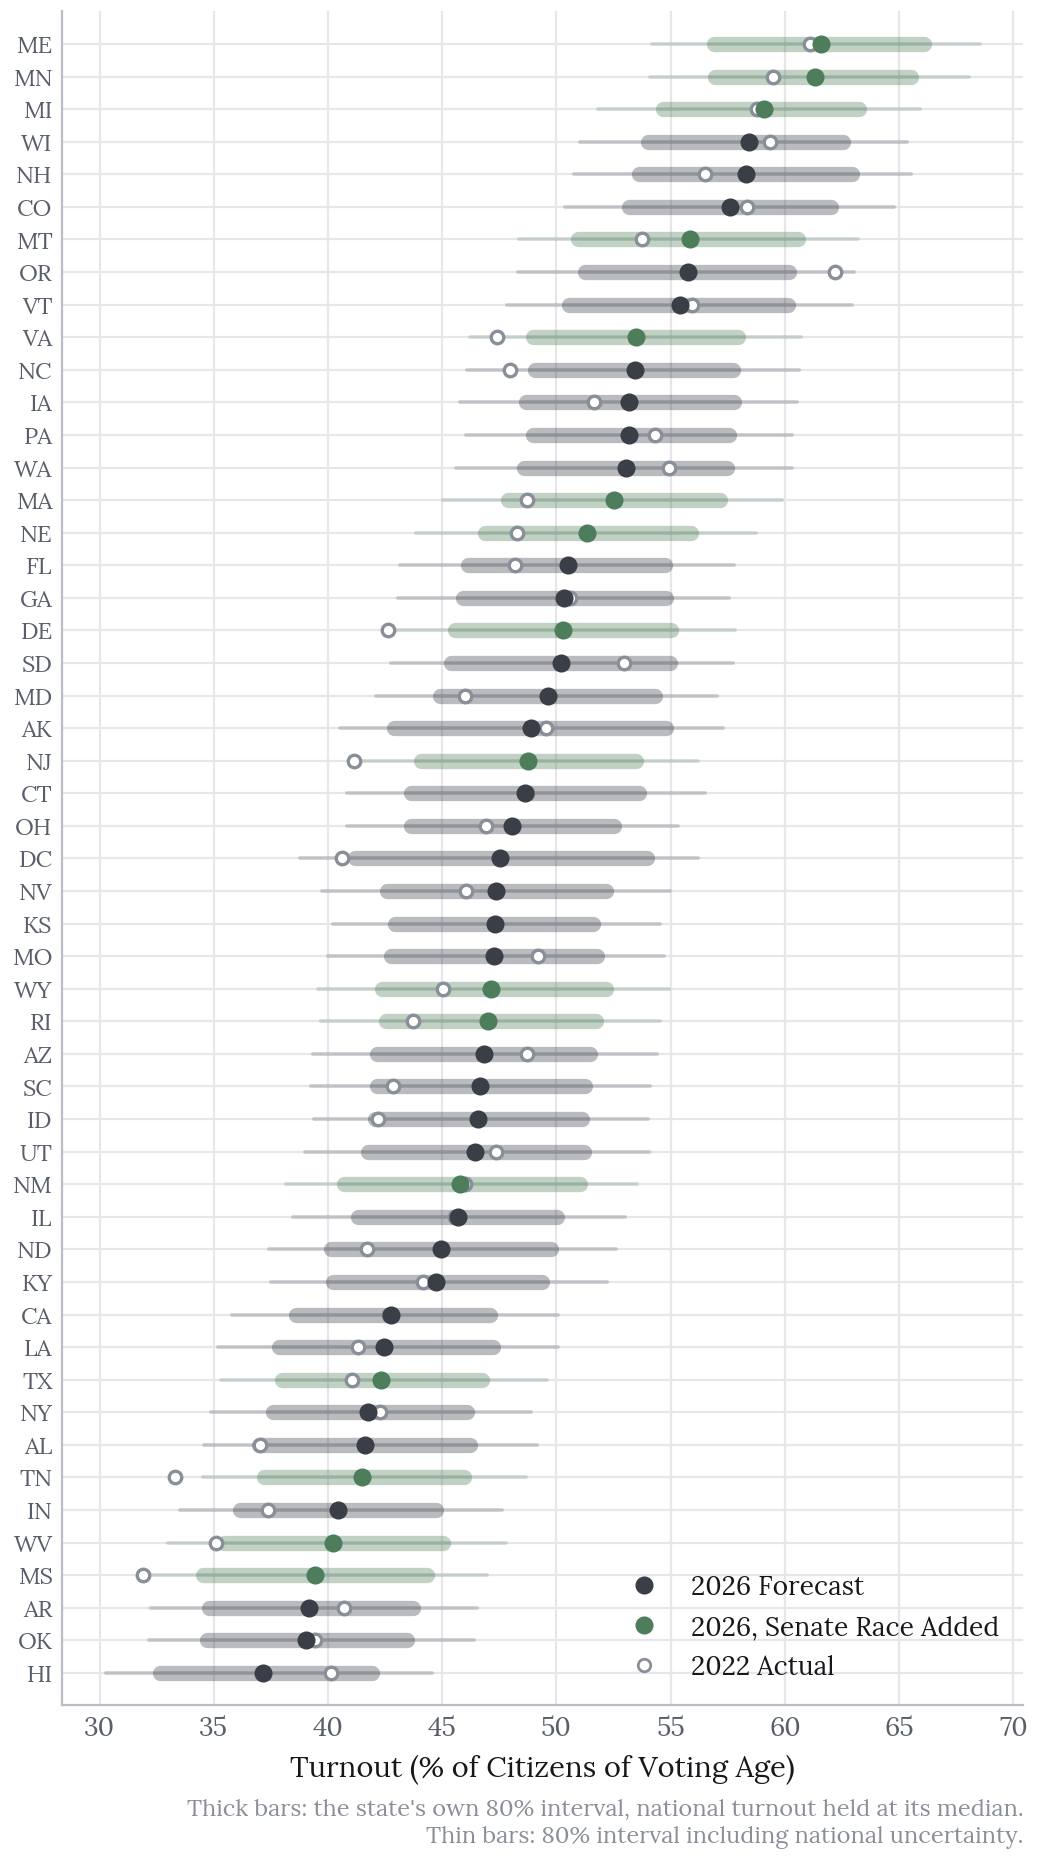
The largest forecast rises come in states with a Senate race on the ballot this year but none in 2022: Tennessee, Delaware, New Jersey and Mississippi each rise by 7.5 to 8 points. Oregon shows the largest fall, of about 6 points, from an unusually high 2022.
The Senate
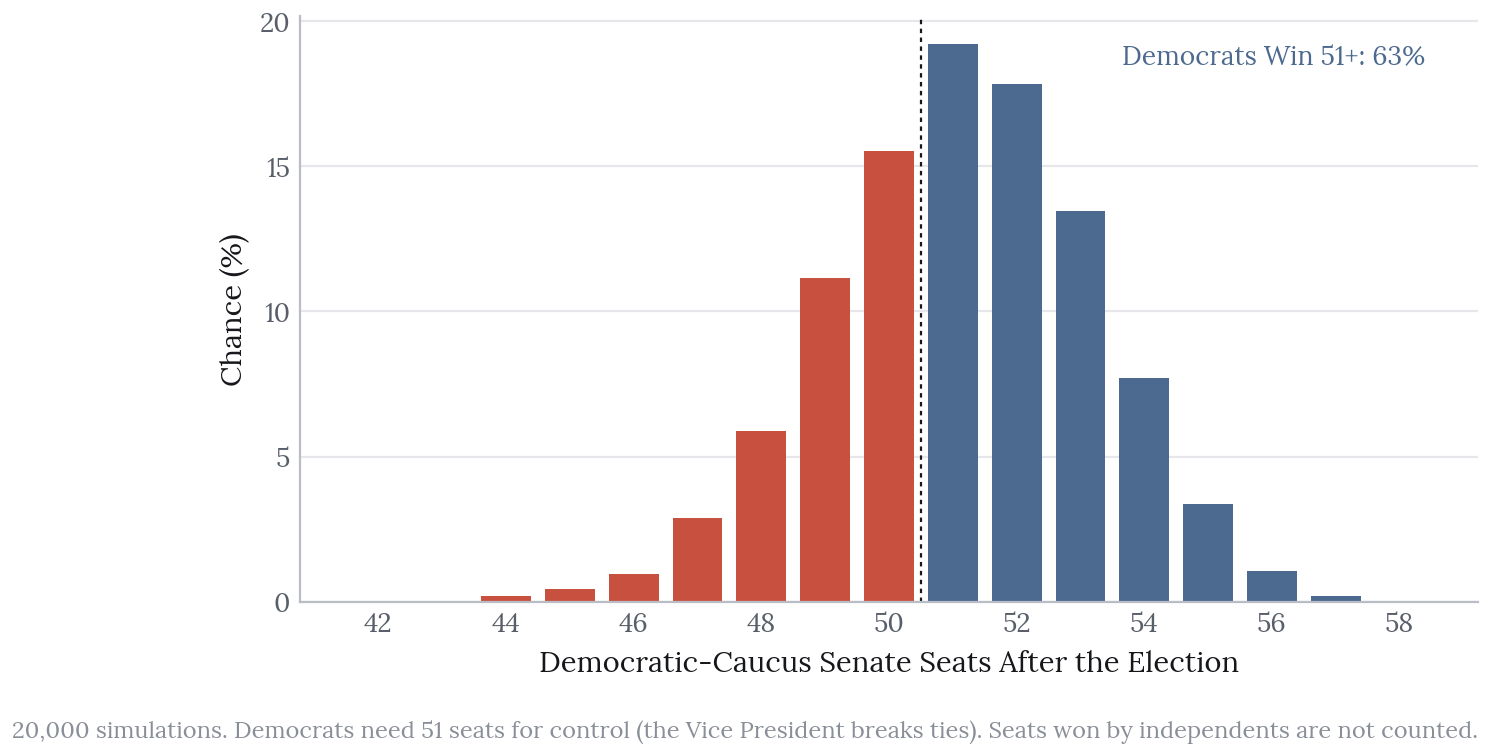
Republicans currently hold 53 seats, and Democrats need 51 for control, since the Vice President breaks ties. Across 20,000 simulations:
| Outcome | Chance |
|---|---|
| Democrats reach 51 or more | 63% |
| Republicans hold 50 or more seats | 33% |
| Neither, with independents holding the balance | 4% |
The most likely outcomes are 51 or 52 Democratic-caucus seats, which sit close enough to the line that small shifts in a handful of races move the control odds a great deal. Without polls the picture reverses, with Democrats reaching 51 in 42% of simulations and Republicans holding 50 in 53%. Given the narrow intervals described above, 63% is probably a little too confident.
Seven Senate races have a favourite below 80%:
| Race | Democrat | Republican | Favoured | Chance |
|---|---|---|---|---|
| Texas | James Talarico | Ken Paxton | Democrat | 55% |
| Alaska | Mary Peltola | Dan Sullivan | Republican | 56% |
| Iowa | Josh Turek | Ashley Hinson | Republican | 57% |
| Ohio (special) | Sherrod Brown | Jon Husted | Democrat | 58% |
| Kansas | Adam Hamilton | Roger Marshall | Republican | 65% |
| Nebraska | Dan Osborn (independent) | Pete Ricketts | Republican | 71% |
| Maine | Troy Jackson | Susan Collins | Democrat | 77% |
Governors
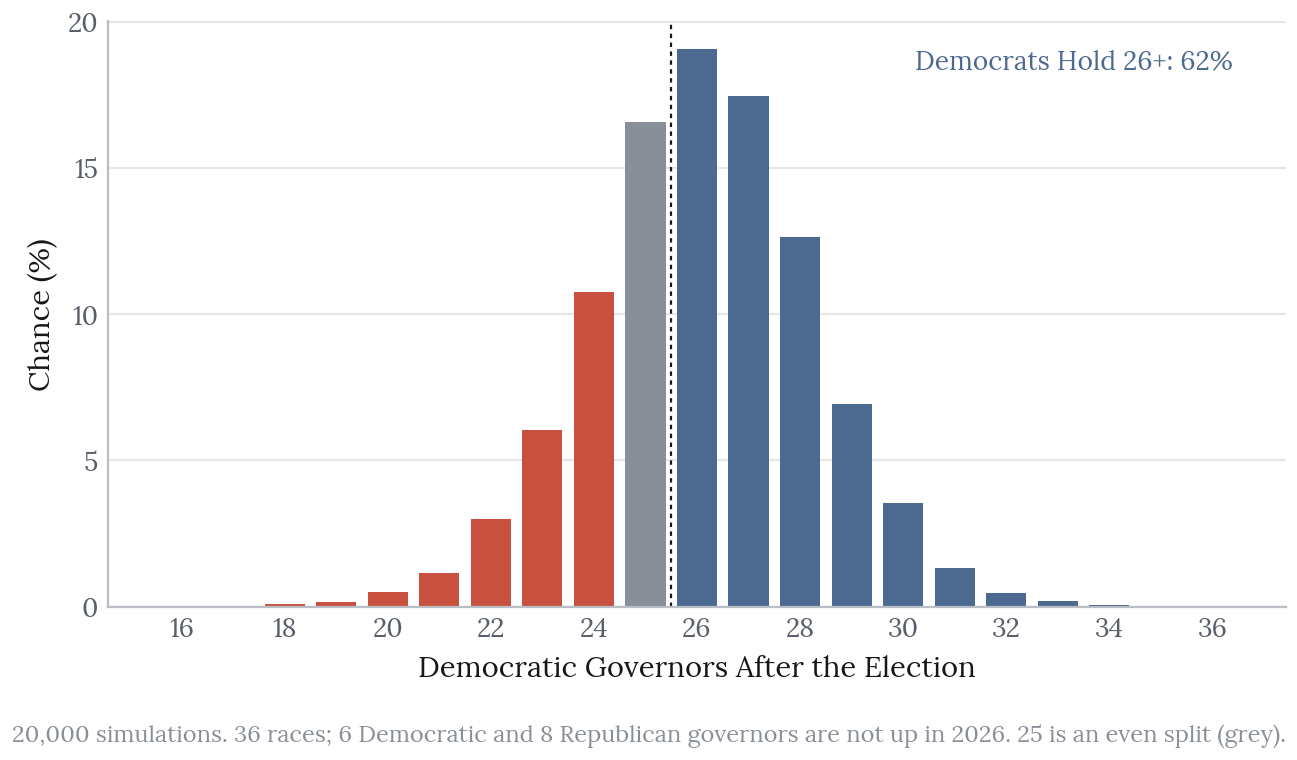
Thirty-six governorships are on the ballot. Republicans hold 26 and Democrats 24, counting Virginia’s change of party in 2025, and of the 14 not up this year six are held by Democrats and eight by Republicans. Democrats hold 26 or more in 62% of simulations, the parties split 25 each in 17%, and Republicans keep a majority in 22%, with a median of 26 Democratic governors (80%: 23 to 29).
Polls matter more here than in the Senate: without them, Democrats reach 26 in only 40% of simulations. The largest moves are in Iowa (from 36% to 85% for Democrats), Michigan (64% to 92%) and Ohio (42% to 69%), against Georgia, which moves from 63% to 46%. The same caution about narrow intervals applies.
Seven governor races have a favourite below 80%:
| Race | Democrat | Republican | Favoured | Chance |
|---|---|---|---|---|
| Georgia | Keisha Lance Bottoms | Rick Jackson | Republican | 54% |
| Nevada | Aaron Ford | Joe Lombardo | Republican | 63% |
| Florida | David Jolly | Byron Donalds | Republican | 64% |
| Alaska | Jonathan Kreiss-Tomkins | Top-four field | Republican | 65% |
| Ohio | Amy Acton | Vivek Ramaswamy | Democrat | 69% |
| Wisconsin | David Crowley | Tom Tiffany | Democrat | 76% |
| Kansas | Cindy Holscher | Ty Masterson | Republican | 76% |
A 60% favourite loses four times in ten, so across these 14 races several upsets are to be expected even if the model is well calibrated.
Every Race, and What Polls Changed
Polls move most races towards the published ratings. The Texas Senate race and the Ohio special turn from Republican favourites into slight Democratic ones, the Alaska and Kansas Senate races tighten, and the Iowa governor’s race moves from 36% to 85% for Democrats; Georgia’s governor’s race moves furthest in the other direction.
What Turnout Does and Does Not Do
The case for forecasting turnout first was that a different electorate might change state leans. In practice it hardly does: re-weighting each state’s presidential result county by county with the forecast turnout moves the lean by about 0.15 points on average across the 71 races, and by half a point at most.
The backtests agree. With the plain presidential lean in place of the turnout-weighted one, the 2022 Brier score of the fundamentals is 0.069 rather than 0.067, while 2018 is slightly better without it (0.147 against 0.149): a small edge in one year and none in the other.
Turnout, then, does not decide who is forecast to win. It matters instead in two places: the county forecast itself, which beats its baseline clearly, and the uncertainty, since each race simulation draws a turnout scenario, so that a high- or low-turnout year moves every lean together. It is a useful result to report — and not the one the project’s name anticipated.
What Was Tested and Left Out
Each candidate input faced the same rule: keep it only if it improves the 2022 backtest on both Brier score and vote-share error, against the fundamentals’ 0.067 and 3.6 points.
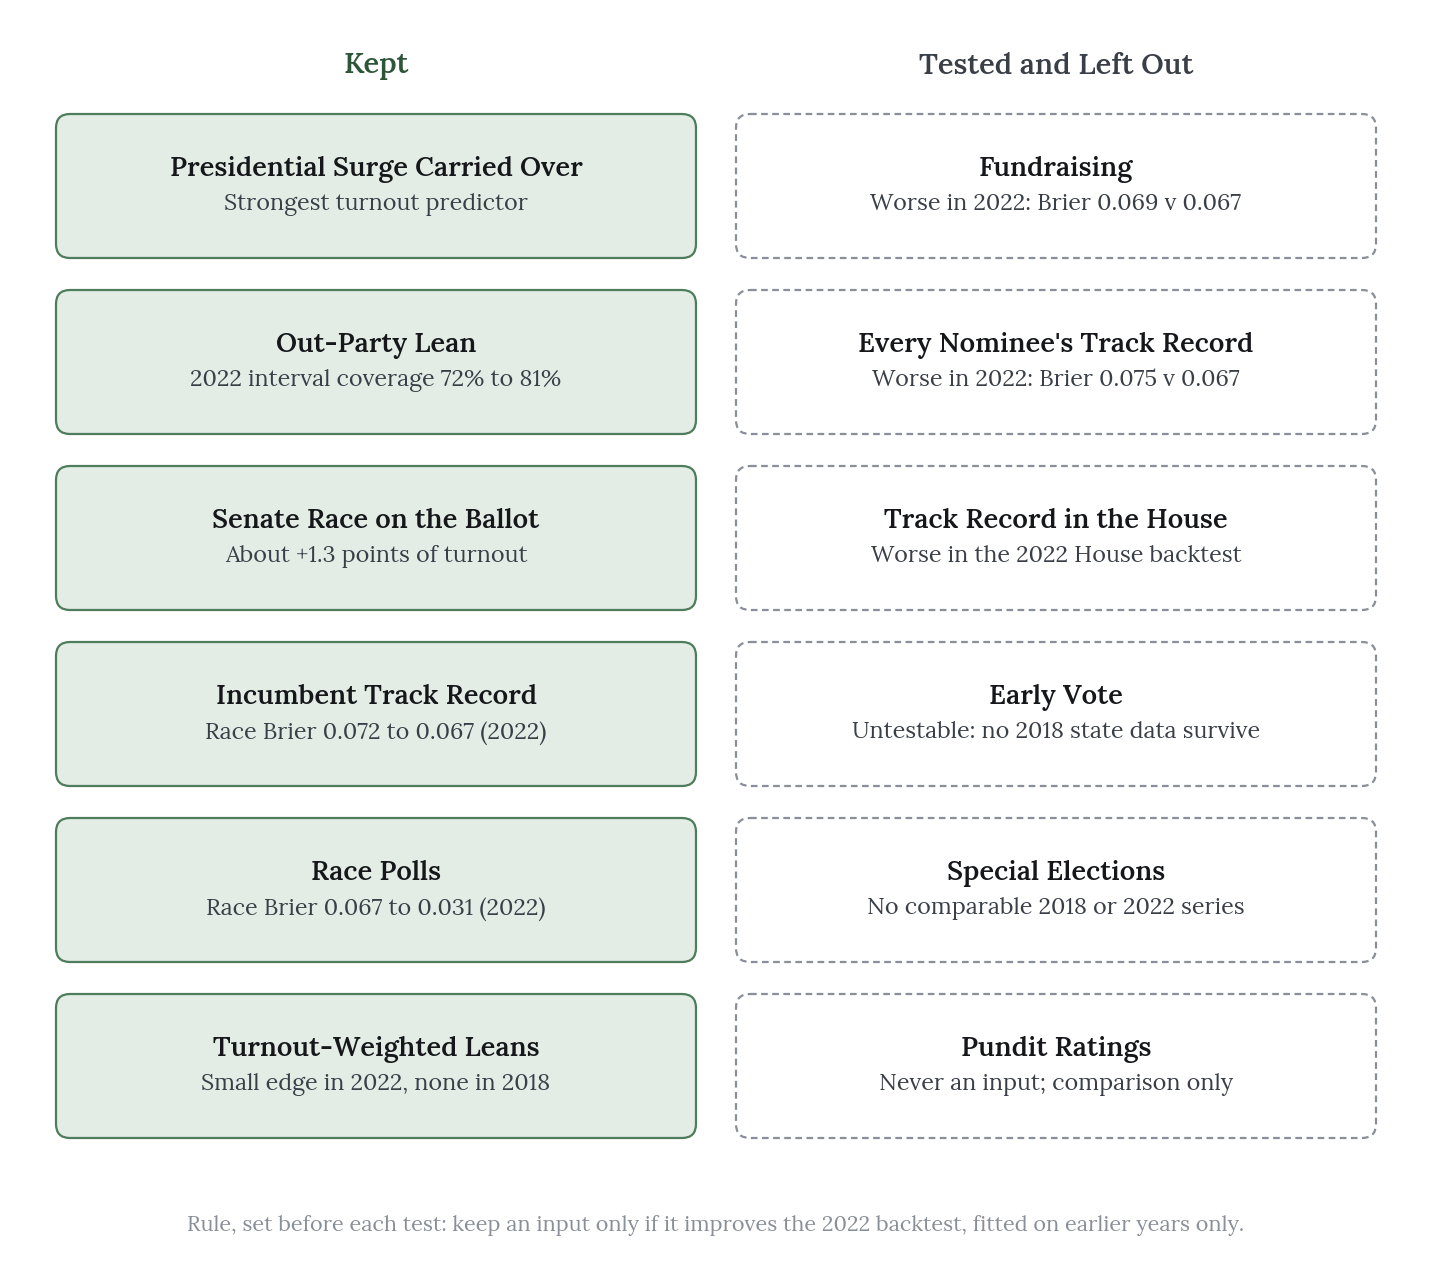
Fundraising. Each Senate nominee’s receipts were taken from the FEC’s June report, the last made public before 1 October. Fundraising made both scores worse (a Brier score of 0.069 and an error of 3.7 points) and was left out. Once the state’s lean, the national environment and the incumbent’s record are in the model, money adds little, largely because well-funded challengers tend to run where the race was already close.
Every nominee’s track record. The incumbent’s track record helps: without it, the 2022 Brier score rises to 0.072. The same measure was therefore built for every nominee who had run statewide before, from their most recent Senate, governor or at-large House race since 2010. It made both scores worse (a Brier score of 0.075 and an error of 3.8 points) and was left out; a challenger’s past result appears to reflect mostly their state’s lean and the national mood of that year, both of which the model already captures. The decision mattered. In the fundamentals forecast this feature moved the Alaska Senate race (Mary Peltola) from 20% to 35% for Democrats and the Ohio special (Sherrod Brown) from 30% to 40%, which are exactly the races where a feature that failed its test should carry no weight.
Early vote. The fair test compares each state’s early-vote pace with its own pace at the same point in the previous midterm, since comparing states with one another mostly measures their voting rules. That test could not be run: no state-level figures from three weeks before the 2018 election survive, and only national totals exist for 2022, so early vote was left out. The 2026 figures have been saved daily up to Election Day, so the test will be possible next cycle.
Special elections. Over-performance in special elections is a common signal of the national mood, but it cannot be backtested here because there is no comparable public series for 2017 to 2018 or 2021 to 2022. Several 2026 contests were, moreover, all-party ballots or contests between two Democrats, which makes a two-party swing hard to define.
Limits
Two backtests. Everything here is judged on 2018 and 2022, and 2018 ran on priors alone. That is enough to show that the model beats a baseline, but not enough to know whether a 70% forecast wins 70% of the time.
Intervals that are too narrow. With polls, the race intervals covered 77% and 71% of results where they should cover 80%. Because the polling error is shared across races, when polls miss they tend to miss in the same direction everywhere; in 2022 they overstated Democrats by about 1.4 points on average.
Independent candidates. In Nebraska, Idaho and South Dakota the model treats the independent as it would a Democrat, with added uncertainty, but there is no history of comparable races on which to test that choice. Where an independent runs alongside both nominees, as in Montana’s Senate race, the polls’ Democrat-against-Republican share ignores them, and the forecast there looks too sure.
The national level dominates. Most turnout error is national, and although the national band is wide, a year like 2018 can still fall outside it.
Denominators are estimates. CVAP is itself a survey estimate, so a handful of very small counties show turnout above 100%, while Chattahoochee County, Georgia shows about 20% because Fort Moore’s residents are counted there but mostly vote elsewhere.
Demographics are fixed. The model uses ACS 2020 to 2024 for every year, because the usable files begin with that vintage. Demographics change slowly and contain no election results, but this is nonetheless a departure from using only what was known at the time.
Data parsed from Wikipedia. Nominees, incumbents, polls and the 2026 generic ballot all come from Wikipedia pages, checked against MIT’s files wherever possible.
Scorecard
The forecast will be scored after the election: provisionally on unofficial results in the week that follows, and finally once the results are certified. The scorecard will publish:
- forecast against result for every race and House district, with Brier score and log loss;
- county turnout error, and how often the actual turnout fell inside the 80% interval;
- calibration of the race forecasts, and how often results fell inside the 80% intervals;
- every miss, with its most likely cause.
The full scoring plan is public in the project’s scoring epic.